The National Statistical Office (NSO), Ministry of Statistics and Programme Implementation has released the estimates of Gross Domestic Product (GDP) for the second quarter (July-September) Q2 of 2019-20, both at Constant (2011-12) and Current Prices, along with the corresponding quarterly estimates of expenditure components of the GDP.
2. The details of estimates of GDP for Q2 of 2019-20 are presented below:
I (a) Estimates at Constant (2011-12) Prices
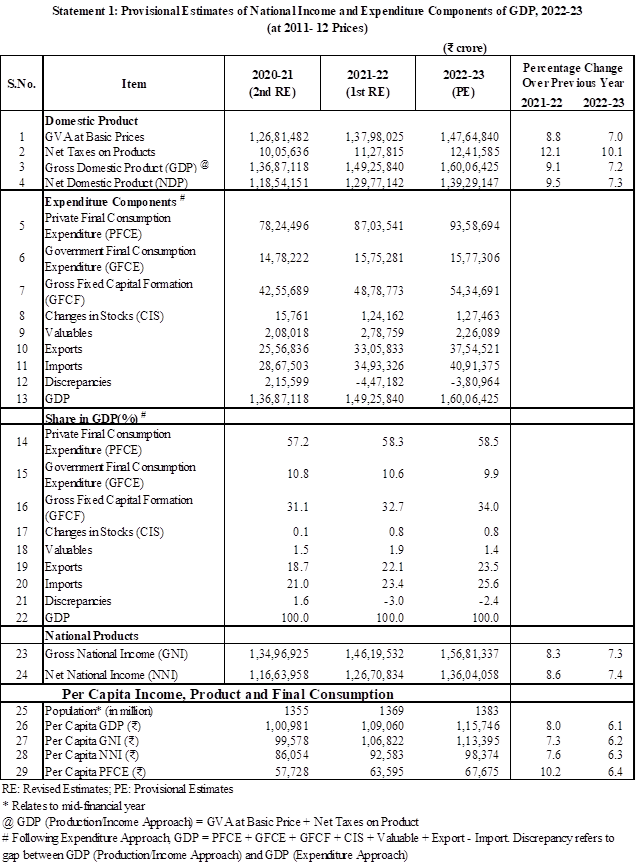
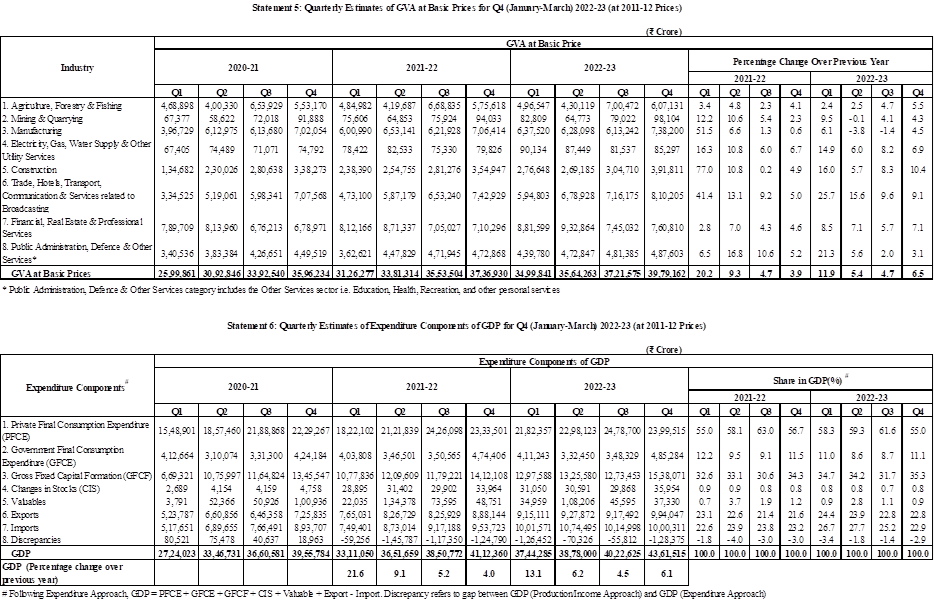
3. GDP at Constant (2011-12) Prices in Q2 of 2019-20 is estimated at ₹35.99 lakh crore, as against ₹34.43 lakh crore in Q2 of 2018-19, showing a growth rate of 4.5 percent. Quarterly GVA (Basic Price) at Constant (2011-2012) Prices for Q2 of 2019-20 is estimated at ₹33.16 lakh crore, as against ₹31.79 lakh crore in Q2 of 2018-19, showing a growth rate of 4.3 percent over the corresponding quarter of previous year.
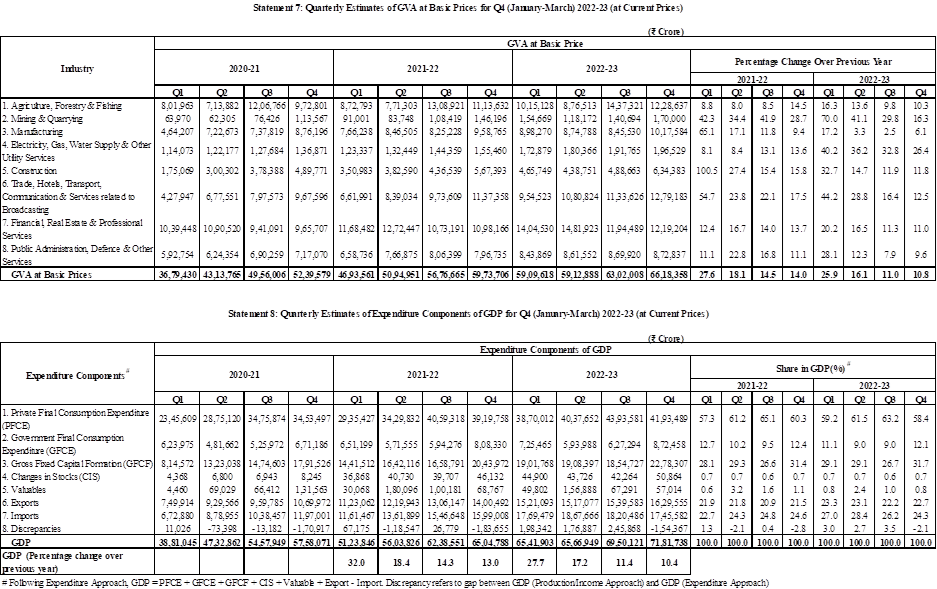
4. The Economic Activities which registered growth of over 4.3 percent in Q2 of 2019-20 over Q2 of 2018-19 are ‘Trade, Hotels, Transport, Communication and Services related to Broadcasting’ ‘Financial, Real Estate and Professional Services’ and ‘Public Administration, Defence and Other Services’. The growth in the ‘Agriculture, Forestry and Fishing’, ‘Mining and Quarrying’, ‘Manufacturing’, ‘Electricity, Gas, Water Supply & Other Utility Services’ and ‘Construction’ is estimated to be 2.1 percent, 0.1 percent, (-) 1.0 percent, 3.6 percent and 3.3 percent respectively during this period.
5. Industry Analysis
The second quarter estimates are based on 1st advance estimates of agricultural production during Kharif season of 2019-20 obtained from the Department of Agriculture, Cooperation & Farmer Welfare (DAC& FW). For Livestock sector, estimates of production of major livestock products (i.e. Milk, Egg, Meat and Wool) obtained from the Department of Animal Husbandry & Dairying and Fish production data obtained from Department of Fisheries have been used.
Index of Industrial Production (IIP); monthly accounts of Union Government Expenditure maintained by Controller General of Accounts (CGA) and of State Government expenditure maintained by Comptroller and Auditor General of India (CAG) for the period July-September 2019-20 have been used. With the introduction of Goods and Services Tax (GST) from 1st July 2017 and consequent changes in the tax structure, the total tax revenue used for GDP compilation includes non-GST revenue and GST revenue. Performance of key sectors like Transport including Railways, Road, Air and Water Transport etc., Communication, Banking and Insurance during the period July-September 2019-20 has been taken into account while compiling the estimates. Performance of the corporate sector during July-September 2019-20 based on data received from BSE / NSE has been taken into account.
Agriculture, Forestry and Fishing
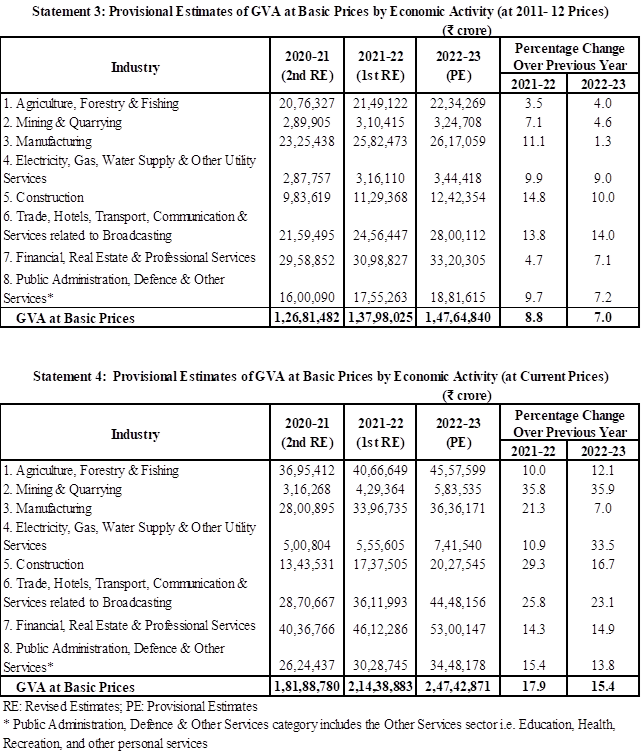
5.1 Quarterly GVA at Basic Prices for Q2 2019-20 from ‘Agriculture, Forestry and Fishing’ sector grew by 2.1 percent as compared to growth of 4.9 percent in Q2 2018-19. The crops including fruits and vegetables account for about 43 percent, the livestock products 39 percent and forestry & fisheries 18 percent share of GVA in total GVA of ‘Agriculture, Forestry and Fishing’ sector.
Mining and Quarrying
5.2. Quarterly GVA at Basic Prices for Q2 2019-20 from ‘Mining and Quarrying’ sector grew by 0.1 percent as compared to growth of -2.2 percent in Q2 2018-19. The key indicators of Mining sector, namely, production of Coal, Crude Oil and Natural Gas and IIP Mining registered growth rates of(-) 10.3 percent, (-) 5.1percent,(-) 2.6 percent and (-)1.2 percent, during Q2 of 2019-20 as compared to 6.2 percent, (-) 4.4 percent, (-) 2.0 percent and 0.9 percent respectively, during Q2 of 2018-19.
Manufacturing
5.3 Quarterly GVA at Basic Prices for Q2 2019-20 from ‘Manufacturing’ sector grew by (-) 1.0 percent as compared to growth of 6.9 percent in Q2 2018-19. The growth of organized sector (which has a share of more than 75 percent in the Manufacturing sector) was estimated from available data of Listed Companies with BSE and NSE. The Quasi -Corporate and Unorganized segment (which has a share of more than 20 percent in the Manufacturing sector) has been estimated using IIP of Manufacturing. IIP Manufacturing registered growth rate of (-) 0.4percent during Q2 of 2019-20 as compared to 5.6 percent during Q2 of 2018-19.
Electricity, Gas, Water Supply and Other Utility Services
5.4 Quarterly GVA at Basic Prices for Q2 2019-20 from ‘Electricity, Gas, Water Supply and Other Utility Services’ sector grew by 3.6 percent as compared to growth of 8.7 percent in Q2 2018-19. The key indicator of this sector, namely, IIP of Electricity registered growth rate of 0.4 percent during Q2 of 2019-20 as compared to 7.5 percent in Q2 of 2018-19.
Construction
5.5 Quarterly GVA at Basic Prices for Q2 2019-20 from ‘Construction’ sector grew by 3.3 percent as compared to growth of 8.5 percent in Q2 2018-19. Key indicators of Construction sector, namely, production of Cement and Consumption of finished Steel registered growth rates of 0.3 percent and 3.3 percent respectively, during Q2 of 2019-20 as compared to 12.5 percent, 9.9 percent respectively, in Q2 of 2018-19.
Trade, Hotels, Transport, Communication and Services related to Broadcasting
5.6. Quarterly GVA at Basic Prices for Q2 2019-20 from this sector grew by 4.8 percent as compared to growth of 6.9 percent in Q2 2018-19. Key indicator used for estimating GVA from Trade sector is the Sales Tax growth. With introduction of GST, Sales Tax data is now subsumed under GST. Therefore, a comparable estimate of turnover based on Sales Tax has been estimated. Methodology of estimation is as explained in the Annex to the press note on estimates of GDP for the second quarter (July-September) of 2017-18 released on 30thNovember, 2017. Indicator used for measuring GVA from Hotels and Restaurant sector is the Private Corporate growth in this sector. Among the Other Services sectors, Cargo handled at Major Sea Ports, Cargo handled by the Civil Aviation and passengers handled by the Civil Aviation registered growth rates of 1.4 percent, (-) 8.7 percent and 1.3 percent respectively, during July-September, 2019-20. Indicators of Railways sector, namely, Net Tonne Kilometers and Passenger Kilometers have shown growth of (-) 7.0 percent and (-) 2.0 percent respectively, during Q2 of 2019-20.
Financial, Real Estate and Professional Services
5.7 Quarterly GVA at Basic Prices for Q2 2019-20 from this sector grew by 5.8 percent as compared to growth of 7.0 percent in Q2 2018-19. Major component of this industry is the Real Estate and Professional Services which has a share of over 75 percent. The key indicators of this sector are the quarterly growth of corporate sector for Real Estate, Business Services and Computer Related Activities which are estimated from available data from listed companies. The other indicators of this sector, viz., Aggregate Bank Deposits, and Bank Credits have shown growth rates of 9.4 percent and8.7 percent respectively as on 11th November, 2019.
Public Administration, Defence and Other Services
5.8 Quarterly GVA at Basic Prices for Q2 2019-20 from this sector grew by 11.6 percent as compared to growth of 8.6percent in Q2 2018-19. The key indicator of this sector namely, Union Government Revenue Expenditure net of Interest Payments excluding Subsidies, grew by 33.9 percent during Q2 of 2019-20 as compared to 22.2 percent in Q2 of 2018-19.
(b) Estimates at Current Prices
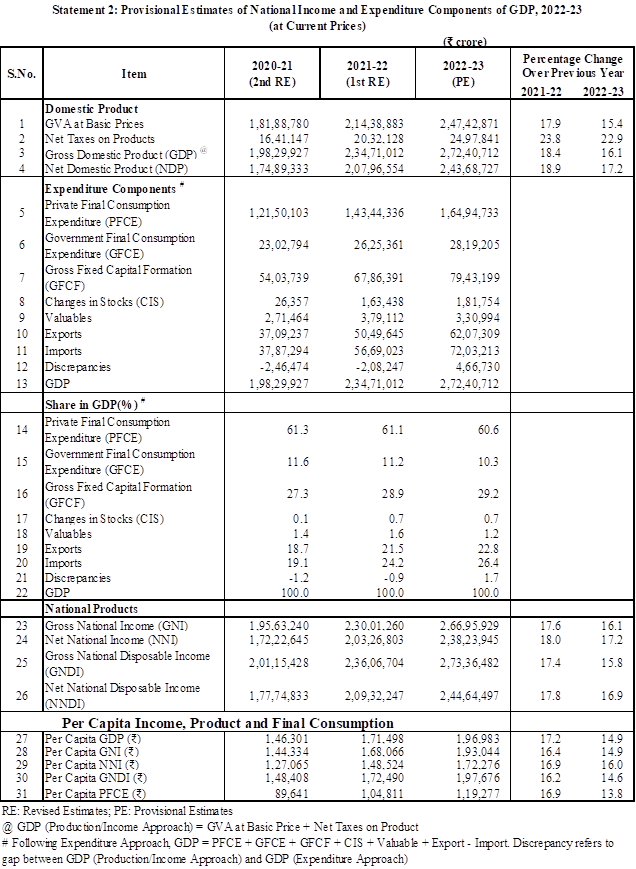
6. GDP at Current Prices in Q2 of 2019-20 is estimated at ₹49.64 lakh crore, as against ₹46.79 lakh crore in Q2 of 2018-19, showing a growth rate of 6.1 percent. GVA at Basic Price at Current Prices in Q2 of 2019-20, is estimated at ₹45.09 lakh crore, as against ₹42.42 lakh crore in Q2, 2018-19, showing an increase of 6.3 percent.Growth rates in various sectors are as follows: ‘Agriculture, Forestry and Fishing’ (7.4 percent), ‘Mining and Quarrying’ ( -4.4 percent), ‘Manufacturing’ ( -1.1 percent), ‘Electricity, Gas, Water Supply and Other Utility Services’ (2.3 percent), ‘Construction’ (4.2 percent), 'Trade, Hotels, Transport and Communication' (6.1 percent), 'Financial, Real Estate and Professional Services' (6.5 percent), and ‘Public Administration, Defence and Other Services' (17.1 percent).
(c) Price Indices used as Deflators
7. The Wholesale Price Index (WPI), in respect of the groups - Food Articlesand All Commodities, has registered a growth of 7.3 percentand 0.9 percent respectively whereas Mining sector, Manufactured products and Electricity declined by 4.4, 0.1 and 1.2 percent during Q2 of 2019-20over Q2 of 2018-19. The Consumer Price Index (CPI) has shown a rise of 3.5 percent during Q2 of 2019-20 as compared to growth of 3.9 percent during Q2 of 2018-19.
II Estimates of Expenditures on GDP
8. The components of Expenditure on Gross Domestic Product, namely, Consumption Expenditure and Capital Formation are measured at Market Prices. The aggregates are presented in the following paragraphs.
Private Final Consumption Expenditure
9. Private Final Consumption Expenditure (PFCE) at Current Prices is estimated at ₹29.42lakh crore in Q2 of 2019-20 as against ₹27.28 lakh crore in Q2 of 2018-19. At Constant (2011-12) Prices, the PFCE is estimated at ₹ 20.27 lakh crore in Q2 of 2019-20 as against ₹ 19.30 lakh crore in Q2 of 2018-19. In terms of GDP, the rates of PFCE at Current and Constant (2011-2012) Prices during Q2 of 2019-20 are estimated at 59.3 percent and56.3percent, respectively, as against the corresponding rates of 58.3 percent and 56.1per cent respectively in Q2 of 2018-19.Growth rates of PFCE at Current and Constant Prices are estimated at 7.8 percent and 5.1 percent during Q2 of 2019-20 as compared to 14.4 percent and 9.8 percent respectively during Q2 of 2018-19.
Government Final Consumption Expenditure
10. Government Final Consumption Expenditure (GFCE) at Current Prices is estimated at ₹6.92 lakh crore in Q2 of 2019-20 as against ₹5.82 lakh crore in Q2 of 2018-19.At Constant (2011-12) Prices, the GFCE is estimated at ₹4.73lakh crore in Q2 of 2019-20 as against ₹4.09 lakh crorein Q2 of 2018-19. In terms of GDP, the rates of GFCE at Current and Constant (2011-2012) Prices during Q2 of 2019-20are estimatedat 13.9 percent and 13.1percent, respectively, as against the corresponding rate of 12.4 percent and11.9 percentrespectively in Q2 of 2018-19.Growth rates of GFCE at Current and Constant Prices are estimated at 18.9percent and 15.6 percent respectively during Q2 of 2019-20 as compared to 15.4 percent and 10.9 percent respectively during Q2 of 2018-19.
Gross Fixed Capital Formation
11. Gross Fixed Capital Formation (GFCF) at Current Prices is estimated at ₹13.56 lakh crore in Q2 of 2019-20 as against ₹13.68 lakh crore in Q2 of 2018-19. At Constant (2011-2012) Prices, the GFCF is estimated at ₹10.83 lakh crore in Q2 of 2019-20 as against ₹11.16 lakh crore in Q2 of 2018-19. In terms of GDP, the rates of GFCF at Current and Constant (2011-2012) Prices during Q2 of 2019-20 are estimated at27.3percent and30.1percent, respectively, as against the corresponding rates of 29.2 percent and 32.4 percent, respectively in Q2 of 2018-19. Growth rates of GFCF at Current and Constant Prices are estimated at (-) 0.9 percent and (-) 3.0 percent during Q2 of 2019-20 as compared to 16.2 percent and 11.8 percent during Q2 of 2018-19.
12. Estimates of GVA at Basic Price by kind of Economic Activity and the Expenditures on GDP in Q2 (during July-September) and in H1 (half yearly during April-September) of 2017-18, 2018-19 and 2019-20 at Constant (2011-2012) and Current Prices, are given in Statements 1 to 8.
13. The next release of quarterly GDP estimate for the quarter October-December, 2019 (Q3 of 2019-20) will be on 28.02.2020.