The Reserve Bank has been conducting a quarterly residential asset price monitoring survey (RAPMS) since July 2010 on housing loans disbursed by select banks/ housing finance companies (HFCs) 1 across 13 cities, viz., Mumbai, Chennai, Delhi, Bengaluru, Hyderabad, Kolkata, Pune, Jaipur, Chandigarh, Ahmedabad, Lucknow, Bhopal and Bhubaneswar. Time series on selected ratios 2 (i) loan to value (LTV) ratio, a measure of credit risk on housing loans; (ii) EMI-to-income (ETI) ratio - representing loan eligibility; (iii) house price to income (HPTI) ratio – reflecting affordability; and (iv) loan to income (LTI) ratio - another affordability measure, are prepared.
Today, the Reserve Bank released the results of the March 2019 round along with the summary time series data since March 2015.
Highlights:
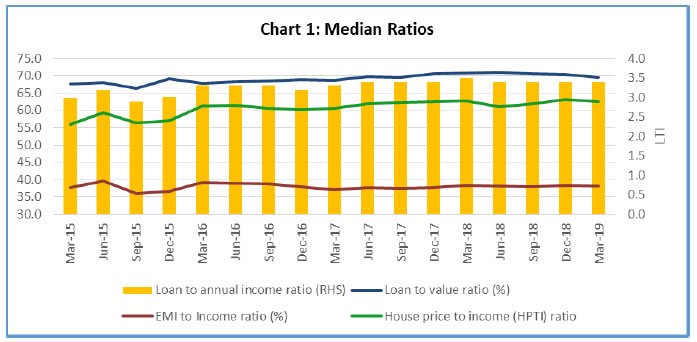
i. The median LTV ratio moved from 67.7 per cent to 69.6 per cent between March 2015 and March 2019 showing that banks have become increasingly risk tolerant ( Chart 1, Table 1).
ii. The median EMI-to-Income (ETI) ratio has remained relatively steady during the past 2 years ( Chart 1); however, Mumbai, Pune and Ahmedabad recorded higher median ETI compared to other cities ( Table 2).
iii. Housing affordability worsened over the past 4 years as the house price to income (HPTI) ratio increased from 56.1 in March 2015 to 61.5 in March 2019 ( Chart 1). Mumbai remains the least affordable city in India, while Bhubaneswar remains the most affordable city ( Table 3).
iv. The movement of median loan to income (LTI) ratio also confirms worsening housing affordability as it moved from 3.0 in March 2015 to 3.4 in March 2019 ( Table 4).
Data on Select Indicators based on Residential Asset Price Monitoring Survey (RAPMS)
| Table 1: Median Value of Select Ratios by Bank Group |
| Quarter | Median Loan to Value (LTV) Ratio
(per cent) | Median EMI to Income Ratio
(per cent) |
| Public Sector Banks | Private Banks | Foreign Banks | Housing Finance Companies | All | Public Sector Banks | Private Banks | Foreign Banks | Housing Finance Companies | All |
| Mar-15 | 67.7 | 63.5 | 48.0 | 73.3 | 67.7 | 34.3 | 44.0 | 24.2 | 42.6 | 37.8 |
| Jun-15 | 68.1 | 63.8 | 45.5 | 74.4 | 68.1 | 37.4 | 42.3 | 20.5 | 43.1 | 39.6 |
| Sep-15 | 65.5 | 63.2 | 44.5 | 71.6 | 66.4 | 32.0 | 39.3 | 21.9 | 43.6 | 36.0 |
| Dec-15 | 69.9 | 64.6 | 44.6 | 72.4 | 69.2 | 32.5 | 40.7 | 19.3 | 44.2 | 36.6 |
| Mar-16 | 66.6 | 64.1 | 41.1 | 71.9 | 67.9 | 39.1 | 40.2 | 20.5 | 39.1 | 39.1 |
| Jun-16 | 66.7 | 65.9 | 41.5 | 72.0 | 68.2 | 38.5 | 41.4 | 17.7 | 39.0 | 39.0 |
| Sep-16 | 67.3 | 66.0 | 41.2 | 72.1 | 68.5 | 38.3 | 40.4 | 22.4 | 38.7 | 38.7 |
| Dec-16 | 67.5 | 67.3 | 40.6 | 71.9 | 68.8 | 38.1 | 38.8 | 18.8 | 38.1 | 38.0 |
| Mar-17 | 66.9 | 67.0 | 49.0 | 72.8 | 68.7 | 36.8 | 36.8 | 17.6 | 37.8 | 37.0 |
| Jun-17 | 67.8 | 66.1 | 41.2 | 74.8 | 69.7 | 37.5 | 37.9 | 19.6 | 38.5 | 37.8 |
| Sep-17 | 67.5 | 65.6 | 47.1 | 74.9 | 69.5 | 37.1 | 38.0 | 18.3 | 38.4 | 37.5 |
| Dec-17 | 68.8 | 67.6 | 43.2 | 75.0 | 70.6 | 37.5 | 38.3 | 15.7 | 37.9 | 37.7 |
| Mar-18 | 69.5 | 66.7 | 64.6 | 75.0 | 70.8 | 38.9 | 38.2 | 28.3 | 37.8 | 38.4 |
| Jun-18 | 70.6 | 64.8 | 60.5 | 75.0 | 71.1 | 38.1 | 38.6 | 25.0 | 38.3 | 38.2 |
| Sep-18 | 69.8 | 64.3 | 59.5 | 75.0 | 70.5 | 38.3 | 38.3 | 26.9 | 37.8 | 38.0 |
| Dec-18 | 70.3 | 64.8 | 58.9 | 74.7 | 70.5 | 38.7 | 39.6 | 25.5 | 37.1 | 38.3 |
| Mar-19 | 69.9 | 64.6 | 62.9 | 72.0 | 69.6 | 38.3 | 41.1 | 28.5 | 36.4 | 38.2 |
| Table 2: Median EMI to Income Ratio by City (per cent) |
| Quarter | Mumbai | Chennai | Delhi | Bengaluru | Hyderabad | Kolkata | Pune | Jaipur | Chandigarh | Ahmedabad | Lucknow | Bhopal | Bhubaneswar | All |
| Mar-15 | 42.6 | 36.7 | 35.1 | 35.4 | 35.1 | 34.0 | 40.8 | 35.3 | 29.8 | 41.8 | 31.5 | 34.6 | 33.0 | 37.8 |
| Jun-15 | 44.1 | 39.3 | 36.0 | 38.5 | 36.9 | 37.6 | 43.6 | 37.7 | 31.0 | 42.2 | 34.9 | 35.9 | 35.1 | 39.6 |
| Sep-15 | 41.7 | 35.1 | 35.0 | 33.1 | 32.5 | 32.4 | 38.9 | 32.6 | 27.1 | 38.1 | 33.8 | 34.3 | 29.8 | 36.0 |
| Dec-15 | 43.7 | 34.6 | 36.0 | 33.2 | 31.7 | 30.8 | 39.9 | 34.9 | 34.1 | 39.2 | 31.0 | 36.2 | 31.5 | 36.6 |
| Mar-16 | 42.8 | 39.6 | 37.2 | 37.0 | 35.5 | 37.4 | 42.9 | 40.7 | 39.6 | 42.7 | 33.6 | 36.9 | 35.0 | 39.1 |
| Jun-16 | 42.8 | 39.5 | 37.0 | 36.9 | 35.9 | 37.6 | 43.2 | 39.4 | 33.9 | 43.5 | 33.3 | 35.0 | 35.4 | 39.0 |
| Sep-16 | 42.0 | 39.3 | 36.7 | 36.9 | 35.3 | 36.6 | 43.3 | 39.2 | 34.6 | 43.4 | 34.9 | 34.8 | 35.4 | 38.7 |
| Dec-16 | 41.6 | 38.8 | 36.6 | 36.1 | 35.2 | 35.2 | 42.2 | 38.0 | 36.0 | 41.4 | 34.2 | 35.6 | 32.4 | 38.0 |
| Mar-17 | 40.3 | 38.4 | 35.8 | 35.6 | 34.9 | 34.5 | 40.6 | 36.5 | 33.9 | 38.9 | 32.0 | 33.3 | 30.5 | 37.0 |
| Jun-17 | 41.7 | 40.1 | 35.9 | 35.8 | 35.3 | 35.2 | 41.6 | 37.0 | 35.0 | 40.3 | 33.3 | 34.6 | 34.0 | 37.8 |
| Sep-17 | 41.9 | 39.2 | 36.2 | 35.8 | 34.6 | 35.2 | 41.5 | 36.6 | 35.0 | 39.6 | 34.1 | 34.3 | 34.6 | 37.5 |
| Dec-17 | 42.5 | 38.5 | 36.3 | 36.0 | 35.8 | 35.4 | 42.1 | 37.4 | 33.8 | 40.2 | 32.8 | 34.4 | 32.8 | 37.7 |
| Mar-18 | 43.5 | 38.3 | 37.0 | 36.6 | 36.4 | 37.0 | 41.9 | 37.7 | 34.1 | 40.8 | 33.7 | 37.0 | 32.8 | 38.4 |
| Jun-18 | 43.7 | 38.3 | 36.6 | 34.9 | 35.8 | 36.9 | 41.6 | 37.2 | 36.3 | 43.7 | 33.8 | 35.2 | 31.5 | 38.2 |
| Sep-18 | 43.0 | 38.5 | 36.6 | 35.5 | 35.7 | 36.6 | 40.6 | 37.4 | 35.6 | 43.6 | 35.1 | 35.5 | 33.8 | 38.0 |
| Dec-18 | 43.5 | 38.2 | 37.1 | 36.3 | 37.1 | 36.8 | 41.6 | 36.1 | 35.8 | 42.6 | 32.3 | 36.7 | 34.3 | 38.3 |
| Mar-19 | 43.3 | 38.4 | 36.9 | 35.6 | 36.8 | 35.8 | 40.7 | 36.6 | 36.7 | 43.5 | 32.4 | 36.2 | 32.6 | 38.2 |
| Table 3: Median House Price to Monthly Income (HPTI) Ratio by City |
| Quarter | Mumbai | Chennai | Delhi | Bengaluru | Hyderabad | Kolkata | Pune | Jaipur | Chandigarh | Ahmedabad | Lucknow | Bhopal | Bhubaneswar | All |
| Mar-15 | 64.1 | 51.9 | 54.0 | 52.2 | 47.9 | 48.8 | 60.9 | 53.4 | 52.2 | 59.5 | 52.5 | 49.1 | 47.2 | 56.1 |
| Jun-15 | 66.5 | 51.9 | 54.4 | 58.2 | 52.7 | 54.2 | 66.4 | 60.3 | 53.2 | 62.9 | 54.5 | 55.6 | 51.3 | 59.3 |
| Sep-15 | 64.0 | 52.8 | 57.5 | 51.8 | 47.2 | 49.2 | 62.4 | 56.3 | 48.9 | 56.5 | 55.0 | 51.4 | 43.0 | 56.4 |
| Dec-15 | 66.2 | 52.4 | 58.5 | 51.8 | 46.3 | 46.8 | 61.9 | 57.2 | 57.4 | 57.4 | 53.5 | 53.2 | 47.9 | 57.1 |
| Mar-16 | 70.1 | 59.2 | 59.6 | 59.0 | 51.7 | 57.2 | 67.7 | 63.5 | 64.7 | 64.4 | 61.2 | 58.2 | 53.1 | 61.3 |
| Jun-16 | 71.0 | 59.6 | 59.5 | 58.4 | 53.1 | 57.5 | 67.6 | 65.3 | 58.9 | 66.6 | 58.5 | 55.9 | 55.5 | 61.5 |
| Sep-16 | 69.9 | 58.5 | 58.5 | 57.3 | 51.6 | 56.6 | 67.0 | 62.2 | 62.4 | 66.7 | 56.2 | 53.4 | 53.3 | 60.5 |
| Dec-16 | 69.3 | 59.1 | 59.0 | 57.4 | 51.9 | 55.2 | 67.1 | 60.0 | 60.5 | 64.9 | 58.4 | 55.6 | 51.3 | 60.2 |
| Mar-17 | 70.1 | 59.6 | 58.6 | 57.9 | 53.6 | 56.6 | 67.2 | 62.9 | 61.7 | 64.7 | 57.9 | 57.6 | 48.2 | 60.6 |
| Jun-17 | 73.4 | 62.2 | 58.7 | 58.0 | 53.6 | 57.8 | 69.2 | 62.5 | 64.0 | 66.9 | 59.4 | 56.7 | 54.0 | 61.9 |
| Sep-17 | 75.4 | 61.9 | 60.3 | 58.7 | 54.9 | 57.4 | 69.3 | 62.6 | 63.3 | 67.1 | 57.9 | 62.2 | 53.9 | 62.4 |
| Dec-17 | 76.4 | 60.7 | 60.1 | 59.3 | 56.1 | 59.5 | 69.9 | 60.5 | 61.4 | 65.4 | 57.2 | 58.3 | 55.1 | 62.6 |
| Mar-18 | 76.8 | 59.7 | 59.6 | 59.2 | 57.8 | 59.0 | 69.3 | 59.7 | 63.0 | 67.6 | 58.2 | 60.0 | 52.6 | 62.7 |
| Jun-18 | 75.1 | 58.0 | 57.7 | 56.1 | 56.3 | 58.4 | 67.5 | 55.6 | 64.8 | 68.4 | 56.5 | 56.6 | 52.9 | 61.1 |
| Sep-18 | 75.5 | 58.7 | 58.6 | 57.0 | 57.7 | 58.9 | 67.8 | 56.0 | 64.7 | 69.2 | 60.0 | 56.1 | 56.0 | 61.8 |
| Dec-18 | 76.9 | 58.2 | 59.5 | 56.9 | 59.2 | 57.5 | 68.0 | 56.0 | 63.5 | 69.7 | 56.6 | 56.3 | 54.4 | 62.0 |
| Mar-19 | 74.4 | 58.6 | 58.5 | 56.1 | 60.3 | 56.5 | 66.6 | 55.9 | 63.4 | 70.4 | 58.6 | 56.2 | 54.3 | 61.5 |
| Table 4: Median Loan to annual income (LTI) Ratio by City |
| Quarter | Mumbai | Chennai | Delhi | Bengaluru | Hyderabad | Kolkata | Pune | Jaipur | Chandigarh | Ahmedabad | Lucknow | Bhopal | Bhubaneswar | All |
| Mar-15 | 3.4 | 2.9 | 2.8 | 2.8 | 2.7 | 2.7 | 3.3 | 2.8 | 2.3 | 3.2 | 2.5 | 2.7 | 2.5 | 3.0 |
| Jun-15 | 3.5 | 3.2 | 3.0 | 3.1 | 2.8 | 2.9 | 3.6 | 3.0 | 2.5 | 3.3 | 2.8 | 3.0 | 2.8 | 3.2 |
| Sep-15 | 3.3 | 2.8 | 2.9 | 2.7 | 2.6 | 2.6 | 3.2 | 2.6 | 2.2 | 2.9 | 2.6 | 2.7 | 2.4 | 2.9 |
| Dec-15 | 3.5 | 2.8 | 3.1 | 2.8 | 2.5 | 2.5 | 3.3 | 2.8 | 2.9 | 3.1 | 2.5 | 3.0 | 2.5 | 3.0 |
| Mar-16 | 3.7 | 3.3 | 3.2 | 3.1 | 2.9 | 3.1 | 3.6 | 3.4 | 3.5 | 3.5 | 2.9 | 3.1 | 2.8 | 3.3 |
| Jun-16 | 3.7 | 3.3 | 3.1 | 3.2 | 3.0 | 3.2 | 3.7 | 3.3 | 2.9 | 3.6 | 2.8 | 2.9 | 2.9 | 3.3 |
| Sep-16 | 3.6 | 3.3 | 3.1 | 3.1 | 2.9 | 3.1 | 3.7 | 3.2 | 2.9 | 3.7 | 2.9 | 3.0 | 2.9 | 3.3 |
| Dec-16 | 3.6 | 3.3 | 3.1 | 3.1 | 2.9 | 3.0 | 3.7 | 3.1 | 3.0 | 3.6 | 2.9 | 3.0 | 2.7 | 3.2 |
| Mar-17 | 3.6 | 3.4 | 3.1 | 3.1 | 3.0 | 3.1 | 3.7 | 3.1 | 3.0 | 3.5 | 2.8 | 3.0 | 2.6 | 3.3 |
| Jun-17 | 3.9 | 3.6 | 3.2 | 3.1 | 3.1 | 3.2 | 3.8 | 3.2 | 3.1 | 3.7 | 2.9 | 3.2 | 2.9 | 3.4 |
| Sep-17 | 3.9 | 3.5 | 3.3 | 3.2 | 3.1 | 3.2 | 3.9 | 3.2 | 3.2 | 3.6 | 3.0 | 3.2 | 2.9 | 3.4 |
| Dec-17 | 4.0 | 3.5 | 3.3 | 3.3 | 3.1 | 3.2 | 3.9 | 3.2 | 3.0 | 3.7 | 2.9 | 3.2 | 2.9 | 3.4 |
| Mar-18 | 4.0 | 3.5 | 3.3 | 3.3 | 3.3 | 3.4 | 3.9 | 3.3 | 3.2 | 3.8 | 3.0 | 3.4 | 2.8 | 3.5 |
| Jun-18 | 4.0 | 3.4 | 3.3 | 3.1 | 3.2 | 3.3 | 3.9 | 3.2 | 3.2 | 3.9 | 3.0 | 3.1 | 2.7 | 3.4 |
| Sep-18 | 3.9 | 3.4 | 3.2 | 3.2 | 3.2 | 3.3 | 3.8 | 3.2 | 3.1 | 3.9 | 3.1 | 3.2 | 2.9 | 3.4 |
| Dec-18 | 4.0 | 3.3 | 3.3 | 3.2 | 3.2 | 3.2 | 3.8 | 3.2 | 3.2 | 3.9 | 2.8 | 3.3 | 2.9 | 3.4 |
| Mar-19 | 4.0 | 3.3 | 3.2 | 3.1 | 3.3 | 3.2 | 3.7 | 3.1 | 3.2 | 3.9 | 2.7 | 3.2 | 2.8 | 3.4 |
Note: 1) Generally, 32 select banks/ Housing Finance Companies (HFCs) participate in the survey, although this number may vary due to non-reporting/participating by Bank/HFC or non-inclusion of data due to quality control issues.
2) Outliers are discarded while calculation of median ratios. |
|
|

कोई टिप्पणी नहीं:
एक टिप्पणी भेजें